This post extends our previous analysis of the long term GDP growth in developed countries with BRIC.
Table 1 lists average annual increment of GDP per capita
(1990 USD) in developed countries. The best countries demonstrated increments
above $350 per year. Many European countries are between $300 and $350 per
year. It is possible to conclude that intertial economic growth is somewhere
between $320 and $390 per year (in
PPP 1990 US dollars). Some European countries demonstrate poor performance,
e.g. Italy, France, Portugal, Greece.
The long term annual increment for a given country completely
defines the rate of economic growth. According to their GDP per capita levels,
all developed countries are characterized by the rate of inertial growth within
the range between 1.5% per year and 2.5% per year. One should not expect higher
rates, with a low probability of short term fluctuations.
Let’s apply the notation of inertial economic growth to BRIC
countries and assess their performance in terms of their potential rate of inertial
growth. Table 2 lists mean annual increment in GDP per capita in four BRIC
countries, which are rather low: from $64
in India to $114 in China over the same period between 1960 and 2015. This is
three to four times smaller than that in developed countires. Hence, BRIC
countries demonstrate poor performance over longer period.
However, China figures look much better at a shorter interval
of the past 20 years. The annul increment is $242, i.e. approximately 70% of
that in Austria and at the level of France. Since the level of GDP per capita
in China is extremely small by European standards, the rate of growth is much higher – between 3% and 10% per year. (Here we
use data for China, not China-old,
from the Total Economy Database.)
The current rate of 3% to 4% per year is much smaller than one could expect when China would grow along
intertial trajectory of European countries. Figures 1 thru 4 depict various
versions of growth trajectories for BRIC countries.
Table 1. Mean annual increment of GDP per capita
|
|
Mean, 1960-2015
|
|
Austria
|
340
|
|
Belgium
|
326
|
|
Denmark
|
282
|
|
Finland
|
320
|
|
France
|
274
|
|
Germany
|
281
|
|
Greece
|
159
|
|
Ireland
|
357
|
|
Italy
|
212
|
|
Netherlands
|
304
|
|
Norway
|
363
|
|
Portugal
|
191
|
|
Spain
|
240
|
|
Sweden
|
313
|
|
Switzerland
|
262
|
|
United Kingdom
|
286
|
|
Canada
|
323
|
|
United States
|
387
|
|
Australia
|
338
|
|
New Zealand
|
203
|
|
Japan
|
345
|
Table 2. Annual GDP per
capita increment in BRIC countries
|
|
1960-2015
|
1995-2015
|
|
China
|
114
|
242
|
|
India
|
64
|
134
|
|
Brazil
|
83
|
82
|
|
Russia
|
105
|
201
|


Fig. 1. The evolution of real GDP per capita in China
from 1960 to 2015. Three graphs demonstrate annual increment as a function of
GDP per capita, annual increment as a function of time, and the growth rate
(1/year) as a function of GDP per capita.


Fig. 2. The evolution of real GDP per capita in India
from 1960 to 2015. Three graphs demonstrate annual increment as a function of
GDP per capita, annual increment as a function of time, and the growth rate
(1/year) as a function of GDP per capita.


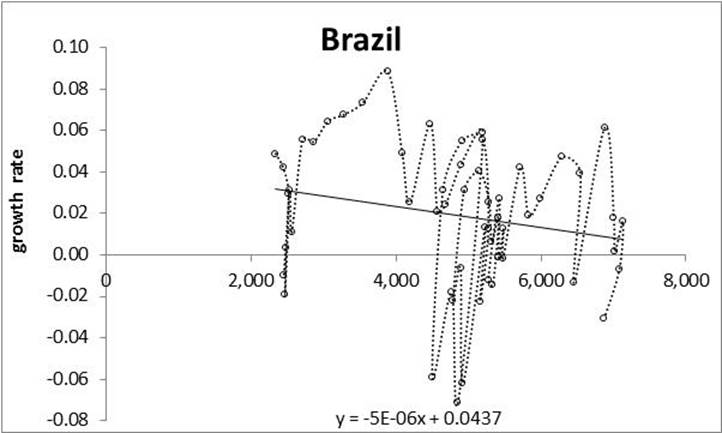
Fig. 3. The evolution of real GDP per capita in Brazil
from 1960 to 2015. Three graphs demonstrate annual increment as a function of
GDP per capita, annual increment as a function of time, and the growth rate
(1/year) as a function of GDP per capita.


Fig. 4. The evolution of real GDP per capita in Russia
from 1960 to 2015. Three graphs demonstrate annual increment as a function of
GDP per capita, annual increment as a function of time, and the growth rate
(1/year) as a function of GDP per capita.

No comments:
Post a Comment